Welcome to totatca.com. In this article, we will explore How to Install and Configure a Grafana Server on the Ubuntu or Debian operating system
What is Grafana?
Grafana is an open-source tool used for visualizing and monitoring data from various sources. It provides a flexible graphical interface to create dashboards containing charts, graphs, and other information from different data sources.
Here are some key features of Grafana:
- Support for Multiple Data Sources: Grafana can connect to various data sources such as Prometheus, InfluxDB, Elasticsearch, Graphite, MySQL, and many other systems. This allows users to monitor and visualize data from multiple sources in a single dashboard.
- Diverse Charts and Graphs: Grafana offers various types of charts and graphs for displaying data. These include line charts, bar graphs, pie charts, real-time graphs, and many other types.
- Dynamic Dashboards: Users can create dynamic dashboards containing interactive panels. This helps create flexible monitoring and analysis experiences.
- Real-Time: Grafana supports real-time data monitoring, allowing users to track events and changes instantly.
- Security and Authentication: It provides authentication mechanisms and role management to ensure the security of data and dashboards.
- Alerting and Notifications: Grafana allows users to configure alerts based on thresholds and conditions. Notifications can be received through various channels such as email, Slack, and more.
- Integration with Various Tools: Grafana can integrate with various tools such as Slack, Microsoft Teams, and other notification services.
- Strong Community: With an active and vibrant community, Grafana continues to evolve with support from user and developer communities.
Prerequisites
- Operating system: Ubuntu or Debian
- User privileges: root or non-root user with sudo privileges
Read more
- Prometheus – Install and Configure Prometheus Server on Ubuntu/Debian
- Prometheus – Install and Configure Node Exporter on Ubuntu/Debian
- How to Install and Configure Snipe-IT Tool on Ubuntu / Debian
- How to Install and Configure GLPI 10 on Debian
- How to Install and Configure Microsoft SQL 2022 on Ubuntu 22.04 LTS
Step by step Install and Configure Grafana Server on Ubuntu or Debian
Step 1 – Update system
First, update the repository for your system using the command below:
sudo apt update
Step 2 – Install the prerequisite packages
After updating the repository, run the following command to install the required dependencies for the Grafana server:
sudo apt-get install -y apt-transport-https software-properties-common wget
Step 3 – Add the Grafana GPG key
The Grafana package is not included in the default Ubuntu/Debian repositories by default. To install Grafana, you’ll need to add the Grafana official APT repository to your system’s APT sources. This will enable your system to recognize and retrieve Grafana packages during the installation process.
First, create a directory named keyrings in /etc/apt to store the keys using the command below:
sudo mkdir -p /etc/apt/keyrings/
Next, add a repository for stable releases, and run the following command:
wget -q -O – https://apt.grafana.com/gpg.key | gpg
--dearmor | sudo tee /etc/apt/keyrings/grafana.gpg > /dev/null
Add Grafana APT repository for stable releases:
echo
"deb [signed-by=/etc/apt/keyrings/grafana.gpg] https://apt.grafana.com stable main"| sudo tee -a /etc/apt/sources.list.d/grafana.list
And run the following command to update the list of available packages:
sudo apt update
Step 4 – Install the Grafana Server
Execute the following command to install Grafana on your system:
sudo apt install grafana -y
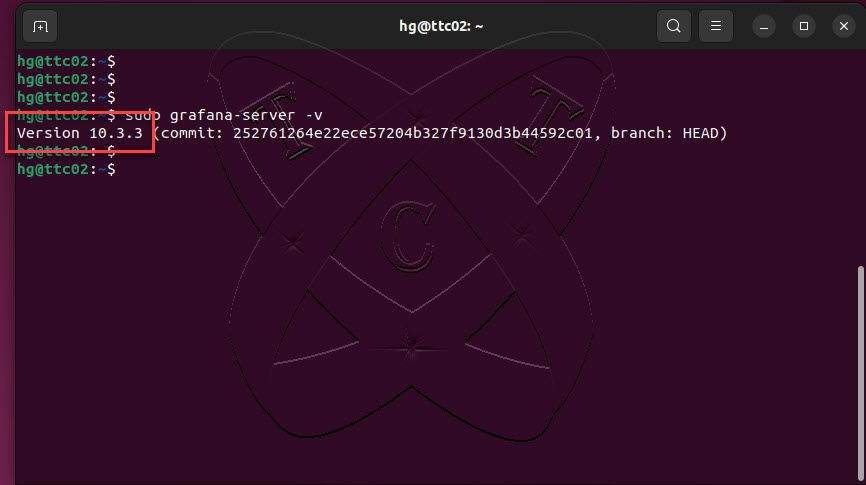
Once the Grafana installation process has been completed, you can verify the version has been installed:
sudo grafana-server -v
At the time of writing, the installed version of Grafana is 10.2.3.
Next, start the Grafana service and enable it to start automatically at system reboot using the following commands:
sudo systemctl start grafana-server
sudo systemctl enable grafana-server
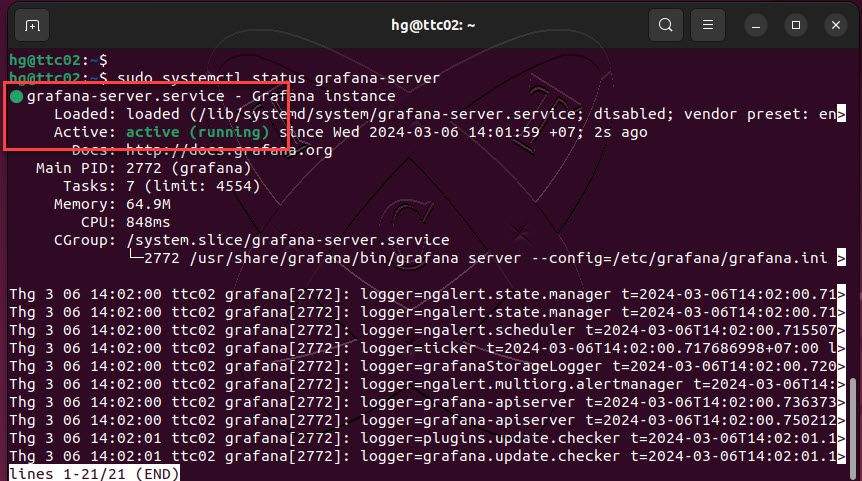
Execute the following command to check the status of the Grafana service, ensuring that its status is running:
sudo systemctl status grafana-server
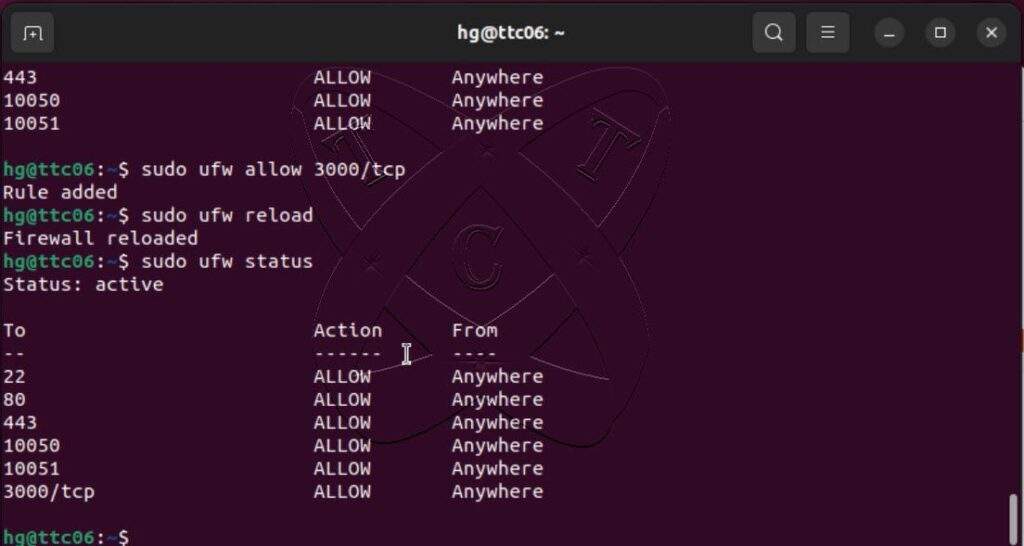
Step 5 – Configure Firewall
Grafana is listening on port 3000. You need to allow port 3000 on your firewall. Skip this step if you are not using the UFW firewall or if the status is inactive.
sudo ufw status
sudo ufw allow 3000
sudo ufw reload
sudo ufw status
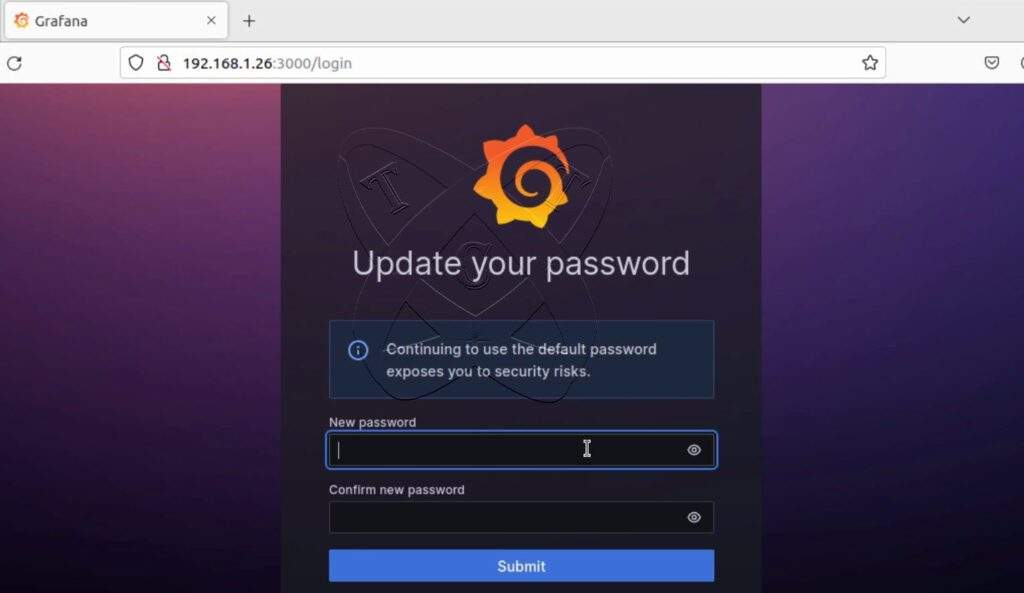
Step 6 – Access the Grafana server
Access the address http://IP-Server:3000. If successful, you will see a login page similar to the one below:

Login with the default account:
- Username: admin
- Password: admin
For the first login, the system will prompt you to change the default password:
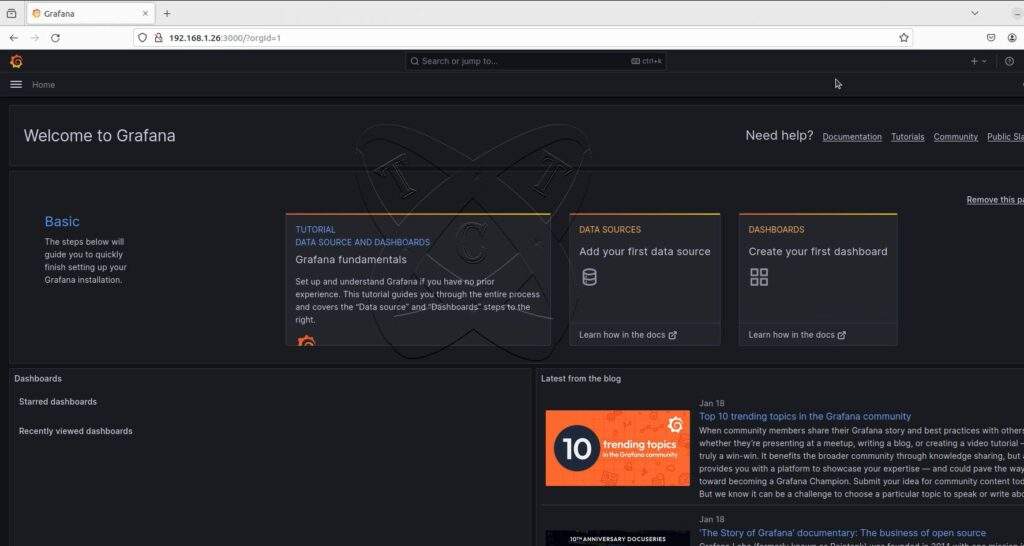
And here is the Grafana server dashboard:
Conclusions
Grafana’s intuitive interface and robust features make it an excellent tool for data analysis on Linux environments. With a properly configured Grafana Server, users can enhance their system monitoring and analytics capabilities.