Welcome to totatca.com. In this article, we will explore How to Install and Configure a Prometheus server on the Ubuntu or Debian operating system together
What is Prometheus?
Prometheus is an open-source monitoring and alerting system, primarily developed to monitor systems and services in distributed server environments.
Here are some key features of Prometheus:
- Service and Target Model: Prometheus uses this model to collect data from targets—these could be servers, applications, or other components of the system.
- PromQL Query Language: PromQL is an expression-based query language for extracting and processing monitoring data. It allows users to perform complex queries for data analysis.
- Multidimensional Data Collection: Prometheus can collect data from multiple sources simultaneously, enabling comprehensive monitoring and analysis of complex systems.
- High-Performance Data Storage: Data is stored in a regular and compressed format, reducing storage space and enhancing query performance.
- Flexible Alerting System: Prometheus supports flexible alerting based on configuration rules and the PromQL alerting language.
- Integration with Other Systems: Prometheus seamlessly integrates with various tools through open interfaces, such as Grafana, Alertmanager, and other monitoring systems.
- Scalability: Prometheus can scale flexibly to handle large numbers of targets and monitor data without compromising performance.
With these features, Prometheus becomes a crucial tool for monitoring and maintaining the performance of distributed systems and applications.
Prerequisites
- Operating system: A server running Ubuntu or Debian has been installed.
- User privileges: root or non-root user with sudo privileges
Read more
- How to Install and Configure Grafana Server on Ubuntu / Debian
- How to Install and Configure Snipe-IT Tool on Ubuntu / Debian
- How to Install and Configure GLPI 10 on Debian
- How to Install and Configure Microsoft SQL 2022 on Ubuntu 22.04 LTS
- How to Install and Configure OpenVPN Server on Ubuntu
Step by step Install and Configure Prometheus Server on Ubuntu or Debian
Step 1 – Prepare
First, update the repository for your system using the following command:
sudo apt update
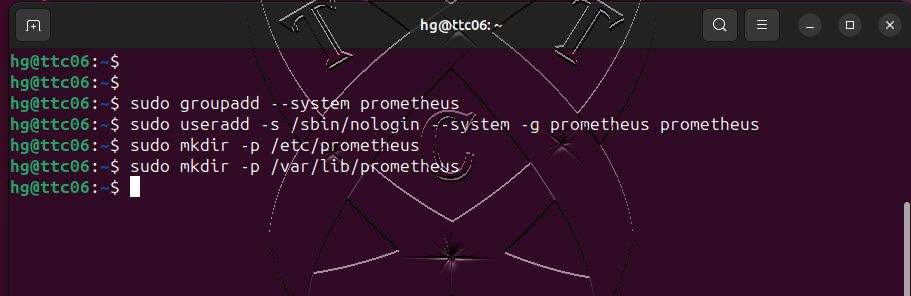
Next, create a new system group named prometheus for the Prometheus server:
sudo groupadd
--system prometheus
Also, create a new system user named prometheus and add to prometheus group:
sudo useradd -s /sbin/nologin
--system -g prometheus prometheus
Create a storage directory named prometheus in the /etc/ and /var/lib directory to store the configuration for the Prometheus server:
sudo mkdir -p /etc/prometheus
sudo mkdir -p /var/lib/prometheus
Step 2 – Download and Extract Prometheus
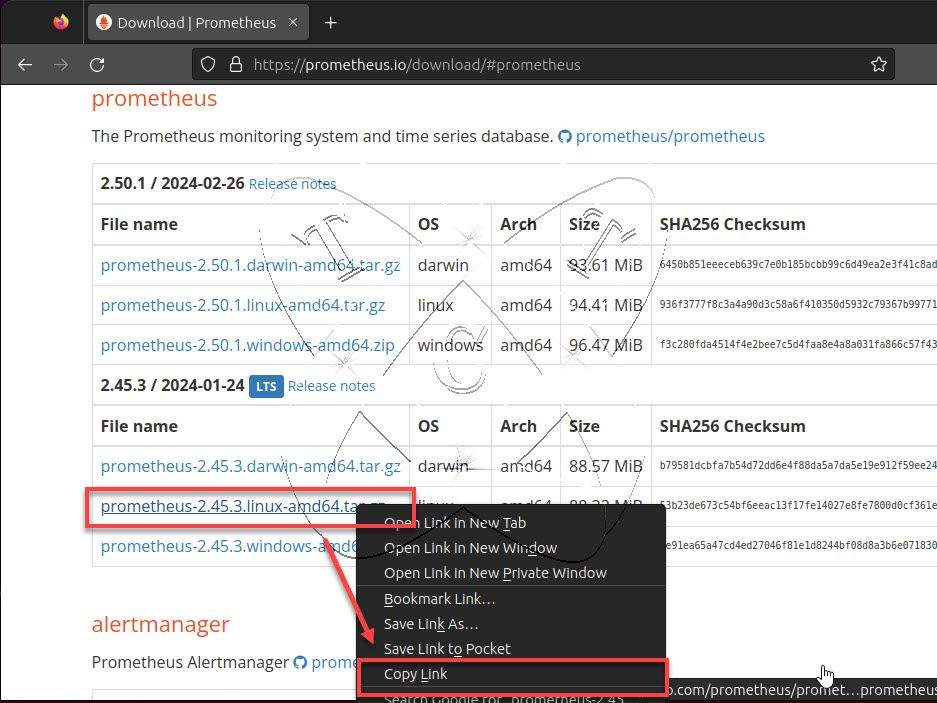
Use your preferred browser to access the official Prometheus website here: https://prometheus.io/download/#prometheus
Select the Prometheus version you want to install – right-click on that version – and choose Copy Link.
I chose the LTS version, at the time of writing, the latest LTS version is 2.45.3
Return to the command-line window and use the following command to download Prometheus:
sudo wget -O prometheus.tar.gz Paste_link_to_here
Example with version 2.45.3 LTS
sudo wget -O prometheus.tar.gz https://github.com/prometheus/prometheus/releases/download/v2.45.3/prometheus-2.45.3.linux-amd64.tar.gz
Download process completed, unzip the downloaded file with the following command:
sudo tar -xvf prometheus.tar.gz
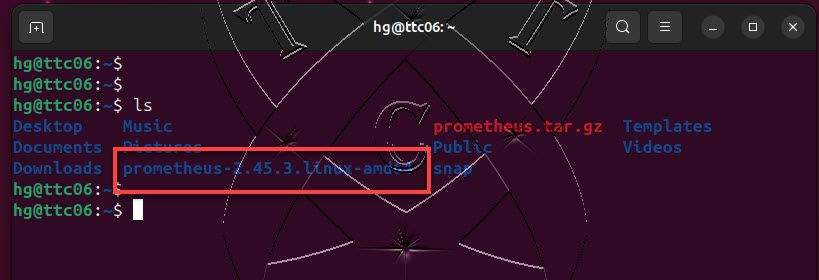
Verify the extracted directory with the following command:
ls
Step 3 – Configure Prometheus
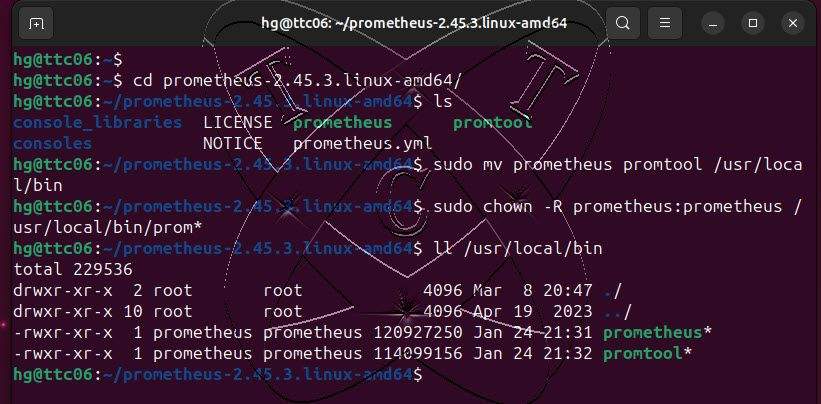
Navigate to the extracted directory,
cd prometheus-2.45.3.linux-amd64
ls
Move the binary files prometheus and promtool to the /usr/local/bin directory:
sudo mv prometheus promtool /usr/local/bin
Change the ownership of /usr/local/bin to the user and group prometheus created earlier:
sudo chown -R prometheus:prometheus /usr/local/bin/prom*
ll /usr/local/bin
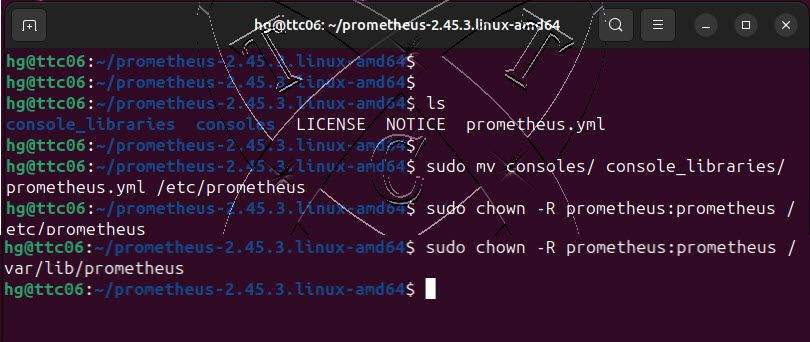
Next, move configuration files consoles, console_libraries, and prometheus.yml to the /etc/prometheus directory:
sudo mv consoles/ console_libraries/ prometheus.yml /etc/prometheus
Also, change ownership of /etc/prometheus and /var/lib/prometheus to the prometheus user and group:
sudo chown -R prometheus:prometheus /etc/prometheus
sudo chown -R prometheus:prometheus /var/lib/prometheus
Step 4 – Configure Prometheus as a Service on the system
Create a new Prometheus system service named prometheus:
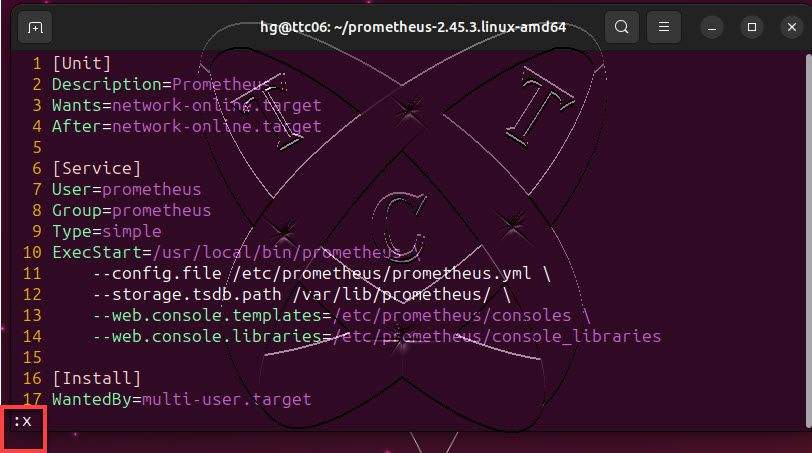
sudo vim /etc/systemd/system/prometheus.service
Add new content below:
[Unit]
Description=Prometheus
Wants=network-online.target
After=network-online.target

[Service]
User=prometheus
Group=prometheus
Type=simple
ExecStart=/usr/local/bin/prometheus \
    --config.file /etc/prometheus/prometheus.yml \
    --storage.tsdb.path /var/lib/prometheus/ \
    --web.console.templates=/etc/prometheus/consoles \
    --web.console.libraries=/etc/prometheus/console_libraries

[Install]
WantedBy=multi-user.target
Save and exit the file by pressing Esc, entering the command :x, and hitting Enter.
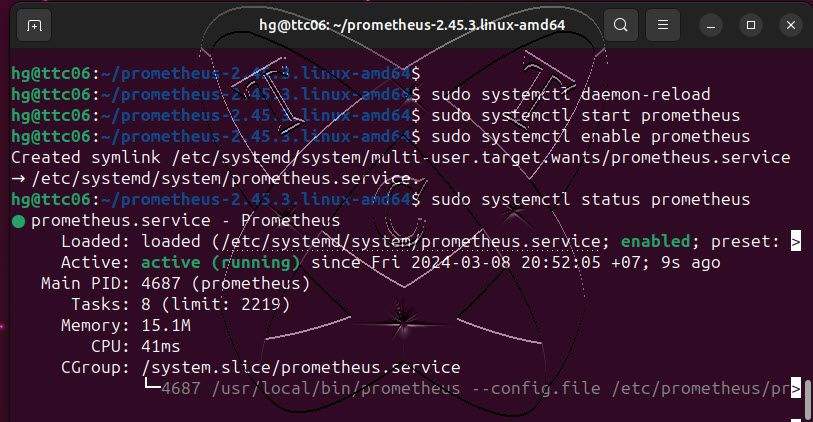
After creating the Prometheus service, make sure to reload the system service to apply any new changes:
sudo systemctl daemon-reload
Start and enable the Prometheus service for automatic startup with the system:
sudo systemctl start prometheus
sudo systemctl enable prometheus
Check the status of the Prometheus service to ensure that its status is running:
sudo systemctl status prometheus
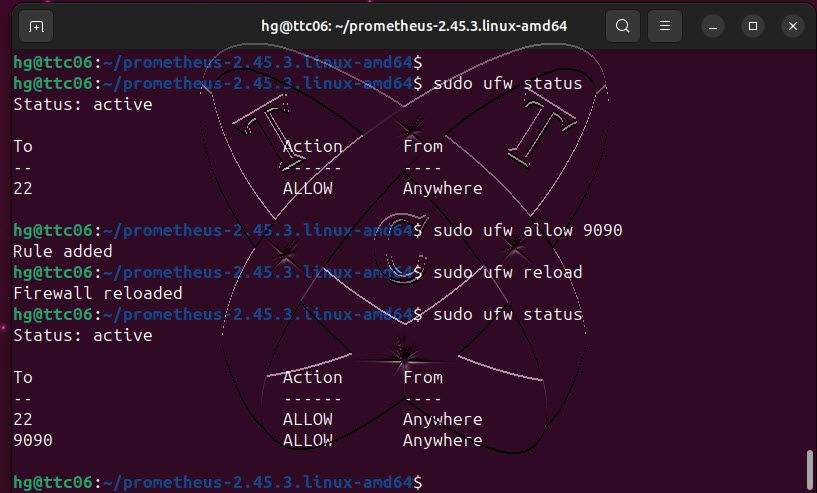
Step 5 – Configure Firewall
Prometheus listens on port 9090. You need to allow this port in the firewall.
Skip this step if you don’t have an active firewall or status of UFW firewall is inactive
sudo ufw status

sudo ufw allow 9090

sudo ufw reload

sudo ufw status
Step 6 – Access Prometheus Server
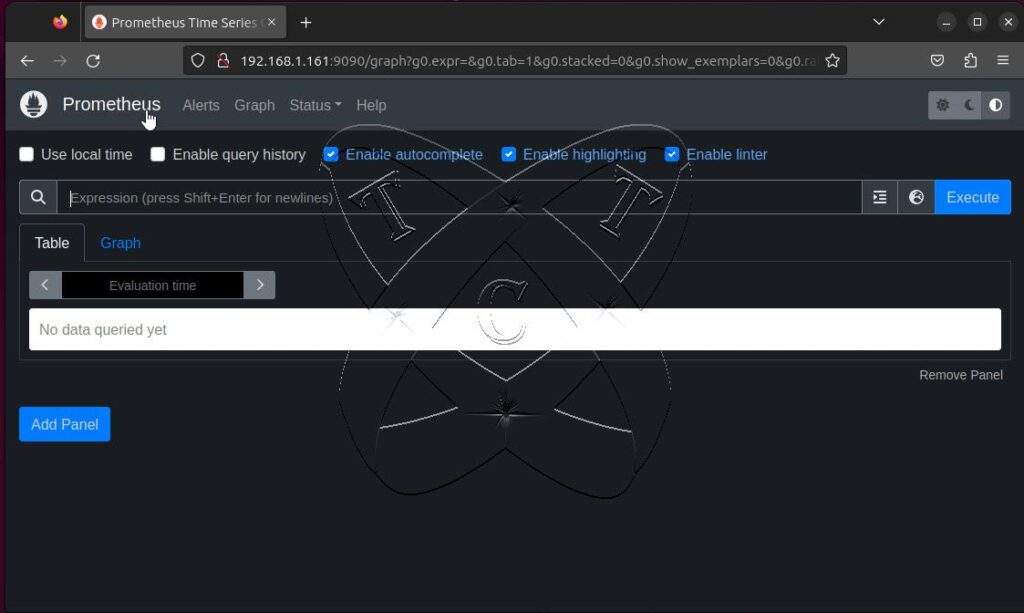
At this point, the Prometheus server has been installed. Use your preferred web browser and access the address http://IP-Server:9090. If successful, you should see the dashboard page as shown below:
Conclusions
Through this article, we have successfully installed the Prometheus server. In the next article, we will explore how to Install and Configure Node Exporter on Ubuntu/Debian/Debian-based servers and integrate it with the Prometheus server for monitoring