Welcome to totatca.com. In the previous post, we successfully installed the Prometheus server. To monitor remote Linux servers, we now need to install Node Exporter on those remote Linux machines. This will enable us to gather data and send it back to the Prometheus server
In this post, we will explore How to Install and Configure Node Exporter on an Ubuntu or Debian system to integrate with the Prometheus server.
What is Node Exporter?
Node Exporter in Prometheus is a tool used for collecting metrics from a system’s hardware and software components and exposing them as Prometheus-compatible metrics. Prometheus is an open-source monitoring and alerting system, and Node Exporter is a crucial extension that helps Prometheus gather detailed information from servers.
Here are some key points about Node Exporter in Prometheus:
- Metrics Collection: Node Exporter collects metrics from system components such as CPU, memory, disk, network, information about running processes, and various details about system operations.
- Output Format: The metrics collected by Node Exporter follow the Prometheus exposition format, a simple text-based format for exporting metrics.
- Easy Installation: Node Exporter can be installed and run on most common operating systems like Linux, Windows, and MacOS with minimal configuration requirements.
- Integrates with Prometheus: Metrics exported by Node Exporter can be collected and stored by Prometheus. Prometheus then uses this data to create graphs, trigger alerts, and perform specific queries to monitor the health and performance of the system.
- Integration with Monitoring Systems: Node Exporter is a crucial component in monitoring systems, assisting organizations in efficiently monitoring and assessing the performance of servers and systems.
- Cross-Platform Support: Node Exporter supports multiple platforms, meaning you can deploy it on various operating systems and machine architectures.
To use Node Exporter, you need to install and configure it on each server you want to monitor, and then configure Prometheus to collect metrics from that specific Node Exporter.
Prerequisites
- Prometheus Server has been installed
- Operating system: A server running Ubuntu or Debian or Debian-based has been installed.
- User privileges: root or non-root user with sudo privileges
Read more
- Prometheus – Install and Configure Prometheus Server on Ubuntu/Debian
- How to Install and Configure Grafana Server on Ubuntu / Debian
- How to Install and Configure Snipe-IT Tool on Ubuntu / Debian
- How to Install and Configure GLPI 10 on Debian
- How to Install and Configure OpenVPN Server on Ubuntu
Diagram
Before we begin, we have the following diagram:
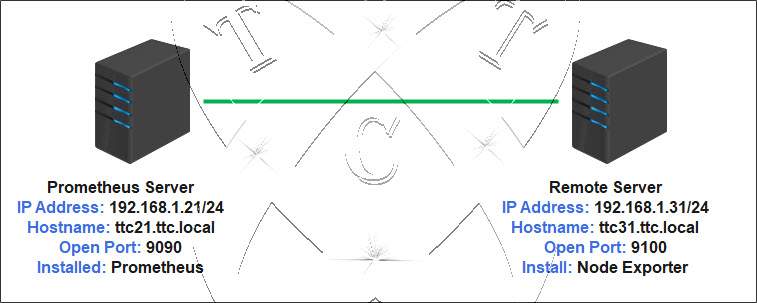
In this diagram:
- The Prometheus server has been installed with the IP address 192.168.1.21
- The Remote server has the IP address 192.168.1.31, and we will proceed to install Node Exporter on the remote server
On Remote Server
Step 1 – Update system
First, update the repository for your system with the following command:
sudo apt update
Step 2 – Download and Extract Node Exporter
Use your preferred browser and visit the official Prometheus page at https://prometheus.io/download/
Scroll down to the node_exporter section, right-click on that version, and choose Copy Link:
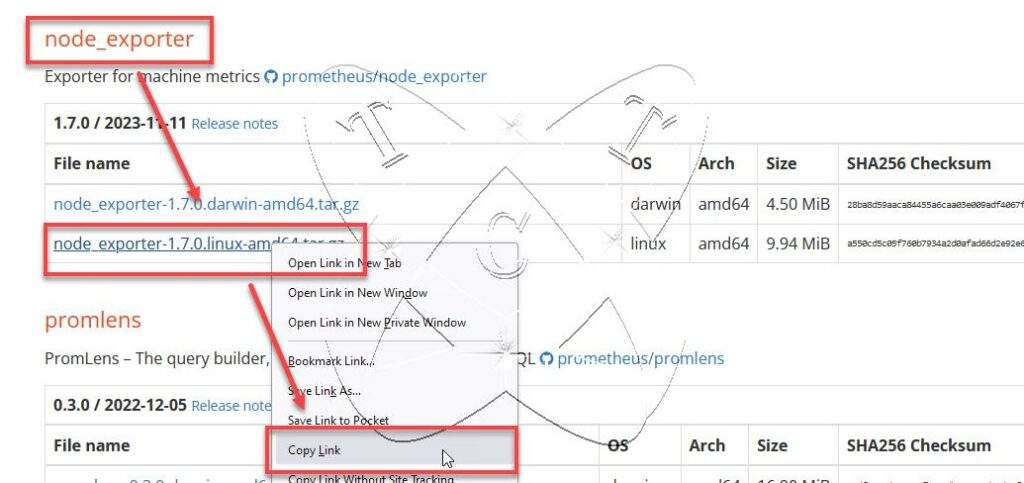
Go back to the command line interface and execute the following command to download Node Exporter:
sudo wget -O node_exporter.tar.gz Paste_link_to_here
Extract the downloaded file using the command below:
sudo tar -xvf node_exporter.tar.gz
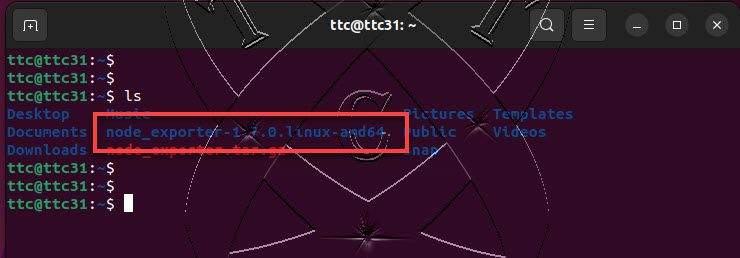
Ensure that you have extracted Node Exporter using the following command:
ls
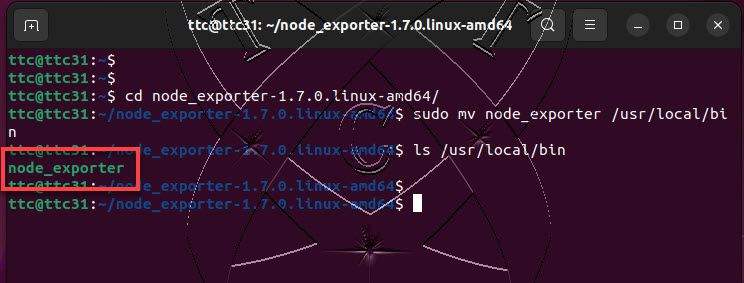
Navigate to the newly extracted directory:
cd node_exporter-1.7.0.linux-amd64/
ls
Move the executable to the /usr/local/bin directory:
sudo mv node_exporter /usr/local/bin

ls /usr/local/bin
Step 3 – Configure Node Exporter as a service on the system
Create a new system user named node_exporter using the following command:
cd /

sudo useradd -rs /bin/false node_exporter
Create a new configuration file named node_exporter for the Node Exporter service
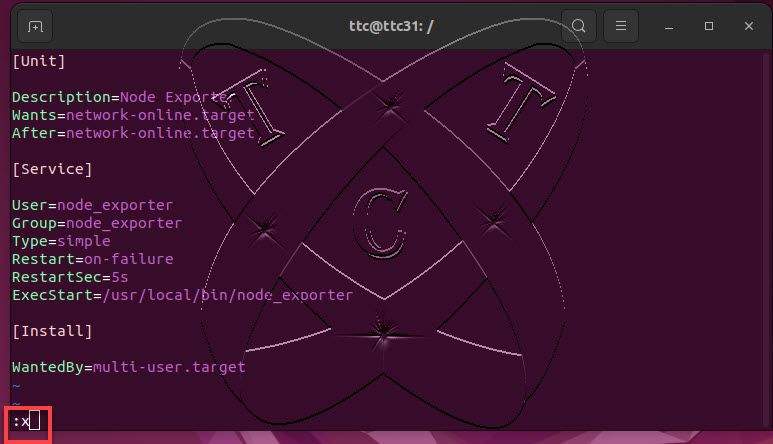
sudo vim /etc/systemd/system/node_exporter.service
Add new content below:
[Unit]
Description=Node Exporter
Wants=network-online.target
After=network-online.target

[Service]
User=node_exporter
Group=node_exporter
Type=simple
Restart=on-failure
RestartSec=5s
ExecStart=/usr/local/bin/node_exporter

[Install]
WantedBy=multi-user.target
Save and exit the file
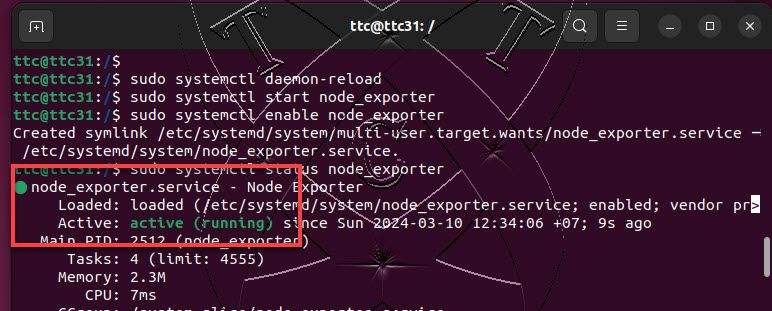
Now, reload the system service to apply the changes:
sudo systemctl daemon-reload
Start and enable the Node Exporter service to automatically start at boot time:
sudo systemctl start node_exporter

sudo systemctl enable node_exporter
Check the status of the Node Exporter service to ensure that its status is running:
sudo systemctl status node_exporter
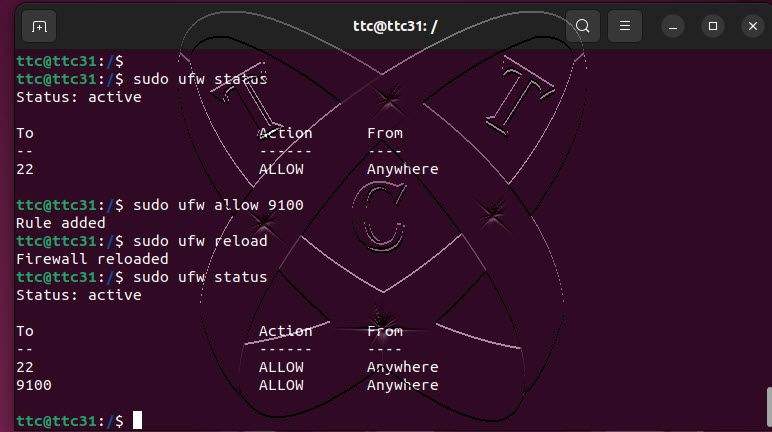
Step 4 – Configure Firewall
The Node Exporter service listens on port 9100; you need to allow this port through your firewall.
Skip this step if you are not using a firewall or if the firewall status is inactive.
sudo ufw status

sudo ufw allow 9100

sudo ufw reload

sudo ufw status
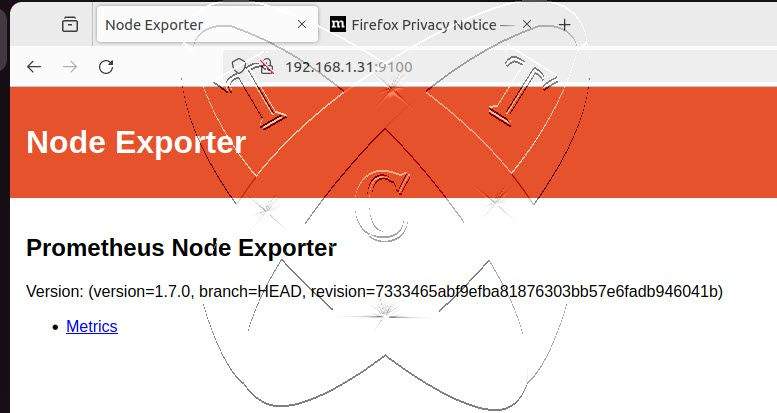
At this point, Node Exporter has been successfully installed and configured. Using your preferred browser, navigate to the address http://IP-Remote-Server:9100. If successful, you should see results similar to the following:
On Prometheus Server
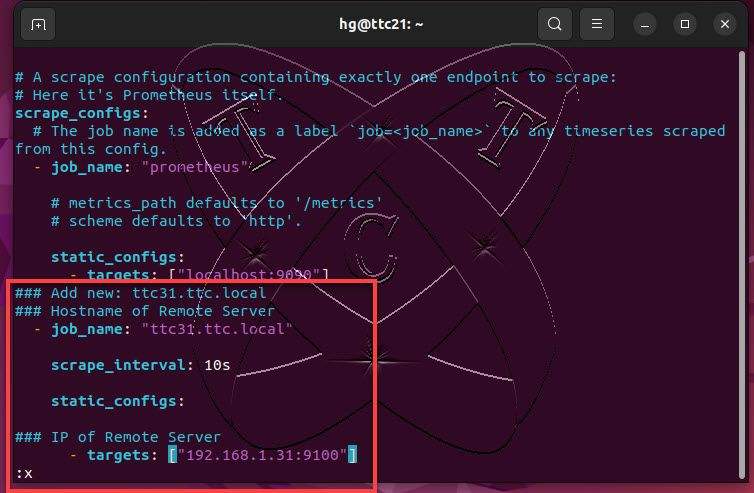
The configuration of Node Exporter on the remote server is complete. Now, move to the Prometheus server, open a command line window, and open the configuration file /etc/prometheus/prometheus.yml with the following command:
sudo vim /etc/prometheus/prometheus.yml
Append the following content to the end of the file:
### Add new: ttc31.ttc.local
### Hostname of Remote Server
  - job_name: "ttc31.ttc.local"

    scrape_interval: 10s

    static_configs:

### IP of Remote Server
      - targets: ["192.168.1.31:9100"]
Save and exit the file.
Now, restart the Prometheus server to apply the changes:
sudo systemctl restart prometheus
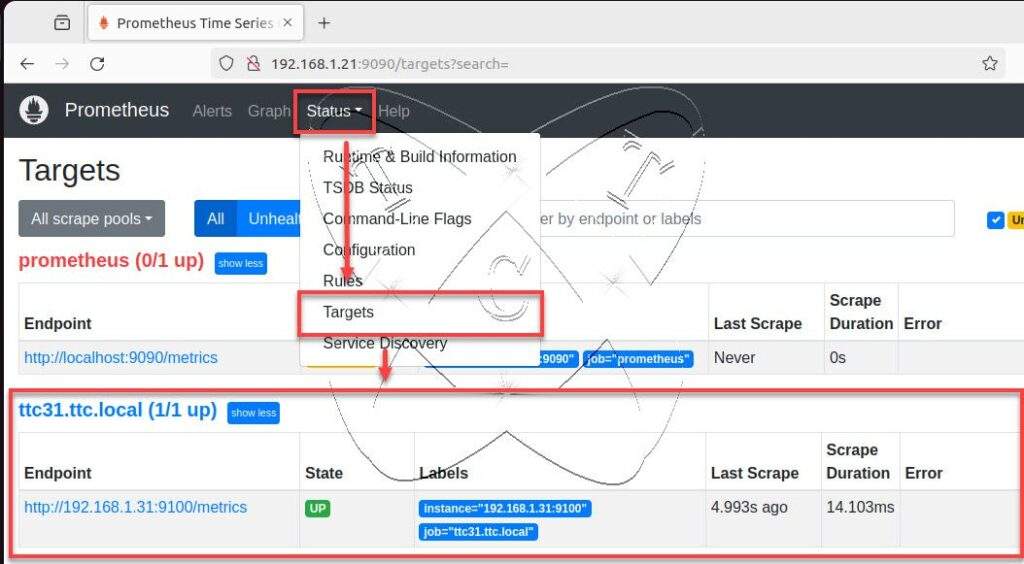
Finally, access the Prometheus server via the address http://IP-Prometheus-Server:9090 , choose Status – select Targets, and you should see the remote server added. Ensure that its status is UP:
Conclusions
In this article, we have successfully installed Node Exporter on a remote server and added it to the Prometheus server for monitoring. In the next article, we will explore monitoring remote servers by integrating Prometheus with Grafana.