Welcome to totatca.com! In this article, we will explore How to integrate Prometheus with Grafana to monitor Linux servers.
In today’s world, system monitoring plays a crucial role in maintaining and managing Linux servers. To simplify this process, this article will guide you on integrating two essential tools, Prometheus and Grafana, to create a powerful and efficient monitoring system.
Prerequisites
- Grafana Server has been installed
Read more: How to Install and Configure Grafana Server on Ubuntu / Debian - Prometheus Server has been installed
Read more: Prometheus – Install and Configure Prometheus Server on Ubuntu/Debian - Node Exporter has been installed on a remote server
Read more: Prometheus – Install and Configure Node Exporter on Ubuntu/Debian
Diagram
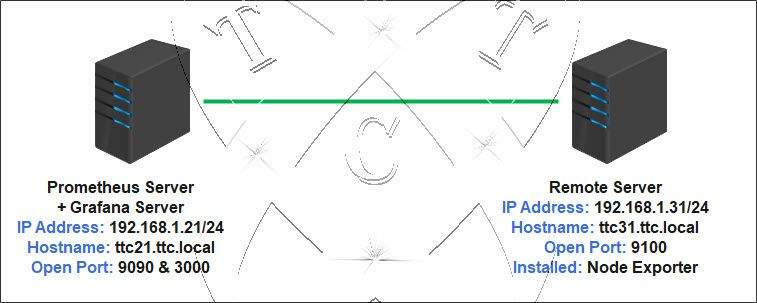
Let’s assume the following:
- Prometheus & Grafana with the IP address 192.168.1.21.
- Node Exporter is installed on a remote host and it is added on the Prometheus server with the IP address 192.168.1.31
Step by step Integrate Prometheus with Grafana
Step 1 – Add data source with Prometheus on Grafana
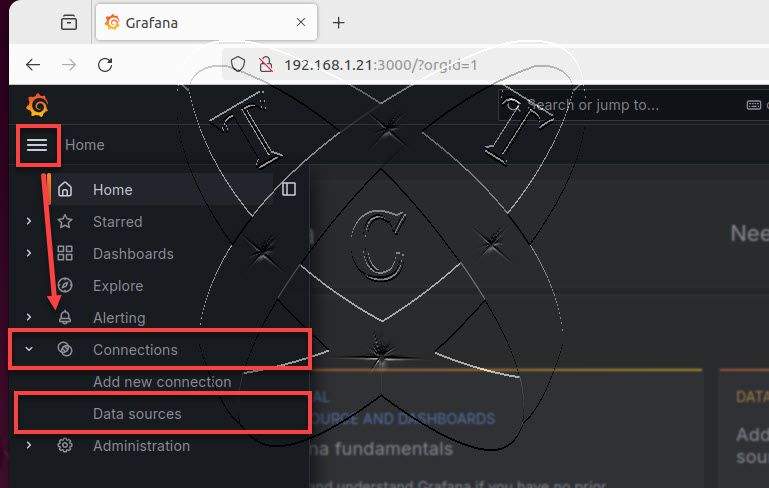
Login to the Grafana server using the address http://IP-Server:3000.
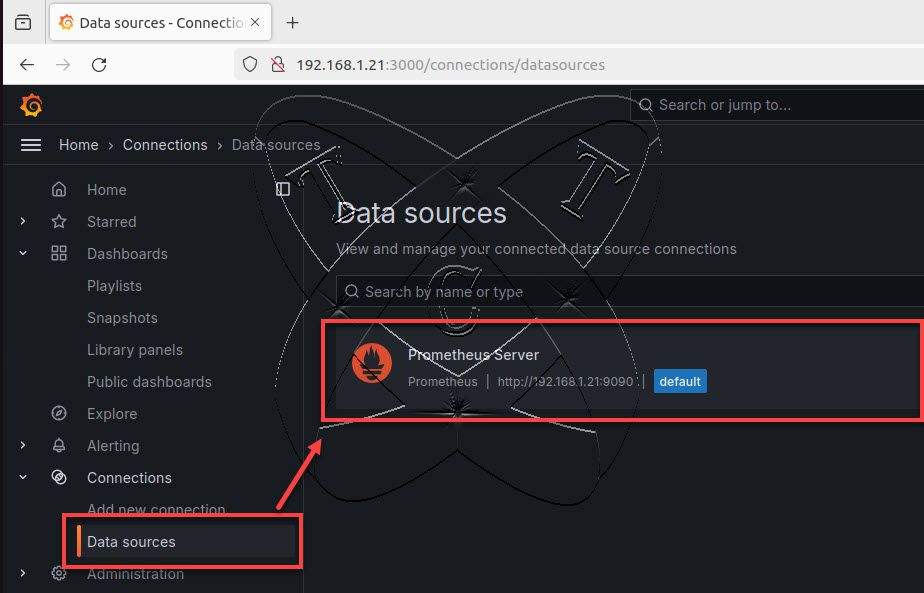
On the Dashboard page, click on the Menu, select Connections, and choose Data sources:
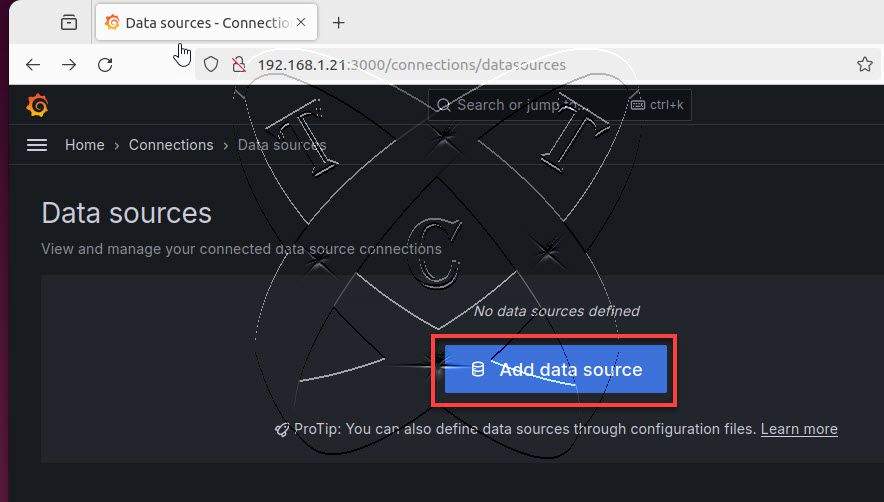
On the Data sources page, click on Add data source:
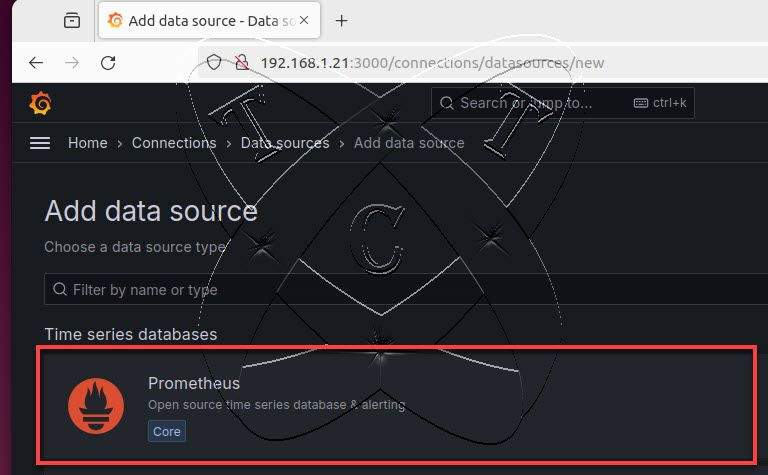
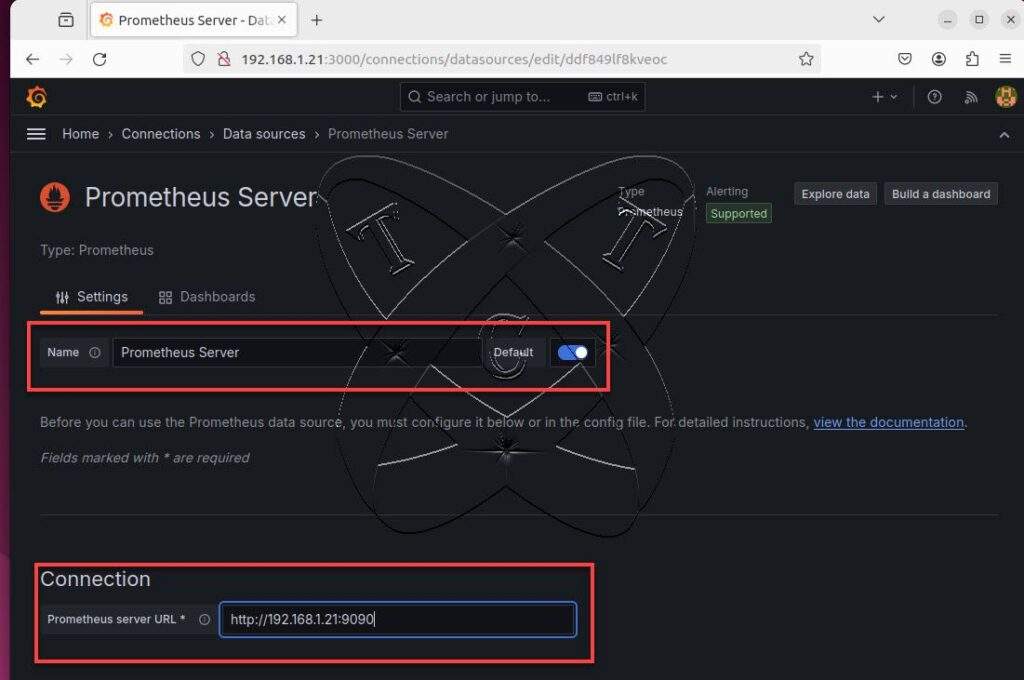
Next, on the Add data source page, select the Prometheus from the list:
Within the scope of this article, we will configure the following two parameters:
- Name: Enter your name (as you prefer)
- Prometheus server URL: Enter the address of the Prometheus server, in this case, it is http://192.168.1.21:9090
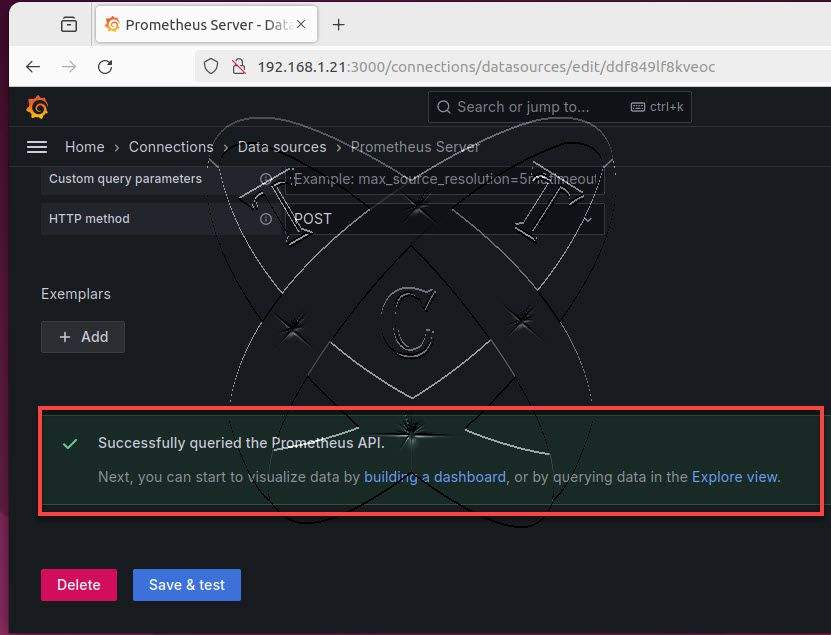
After completing, scroll down to the bottom of the page and click Save & Test. If successful, you will receive a result similar to the one below:
Return to the menu, and you will see that Prometheus has been integrated with the Grafana server:
Step 2 – Import a Grafana Dashboard to Monitor server
Next, we will create a dashboard to monitor remote Linux servers that have Node Exporter installed
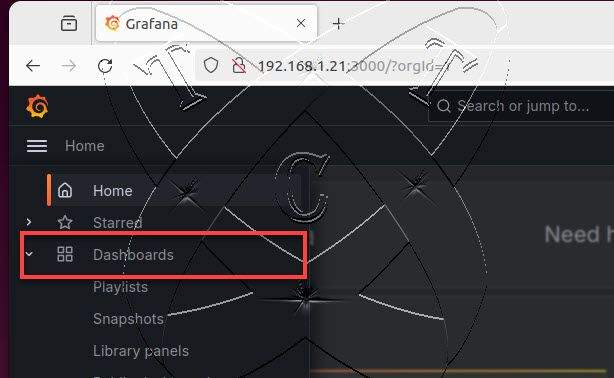
From the Menu – click on the Dashboards button:
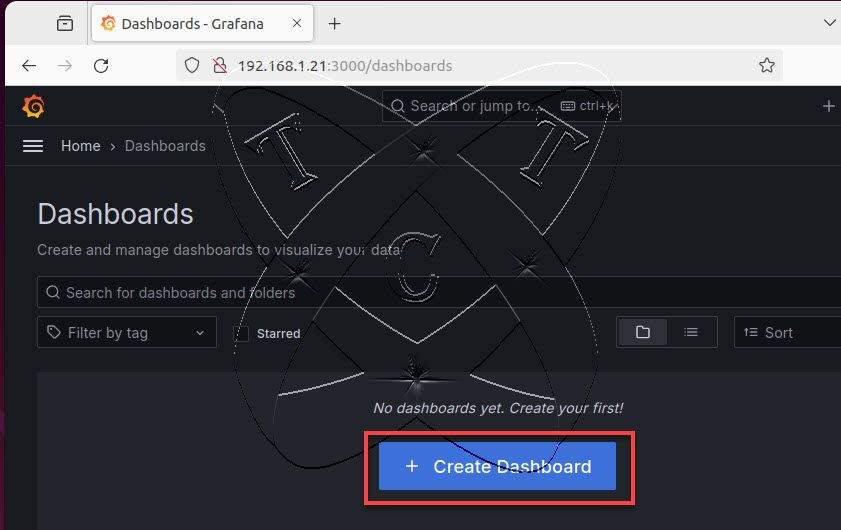
On the Dashboards page – click on the Create Dashboard button:
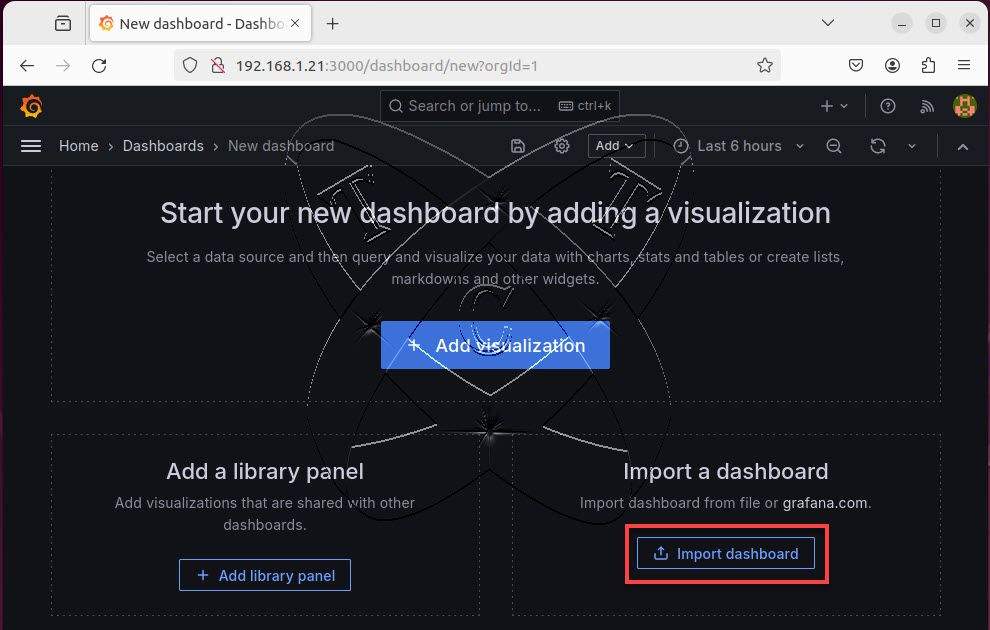
On the New dashboards page – click on the Import dashboard button:
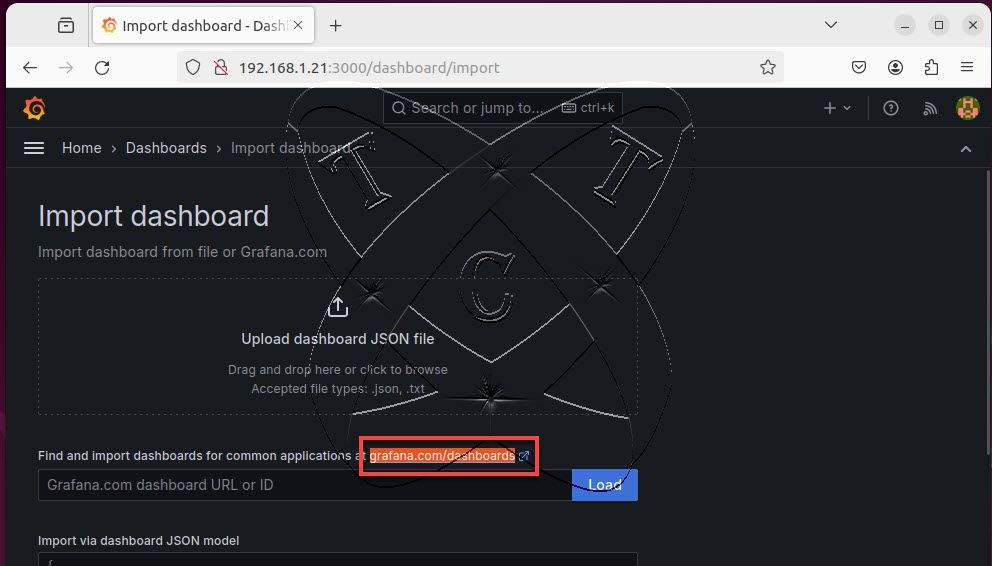
Next, on the Import dashboard page, click on the grafana.com/dashboards link:
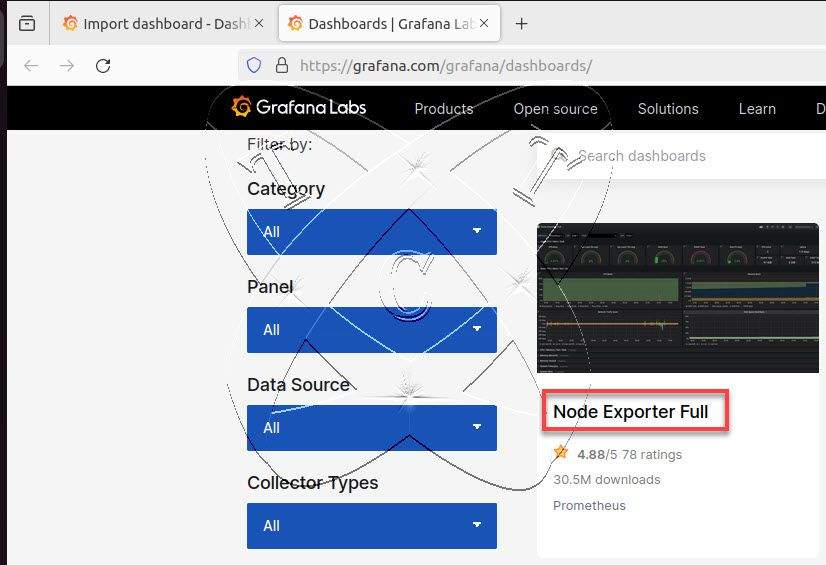
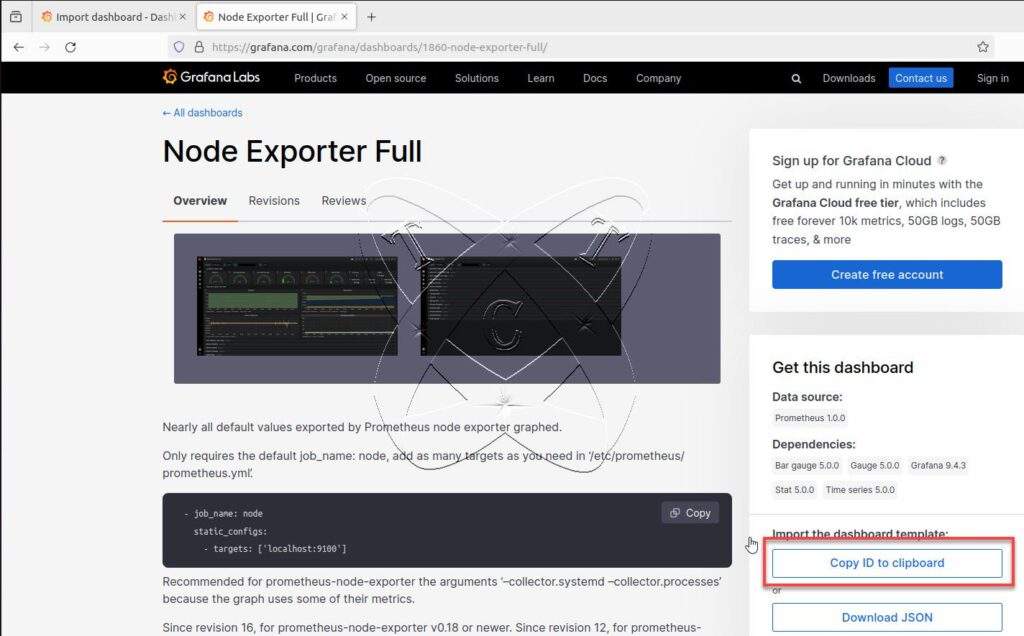
A webpage will open – click on Node Exporter Full
On the Node Exporter Full page, click on the Copy ID to clipboard button:
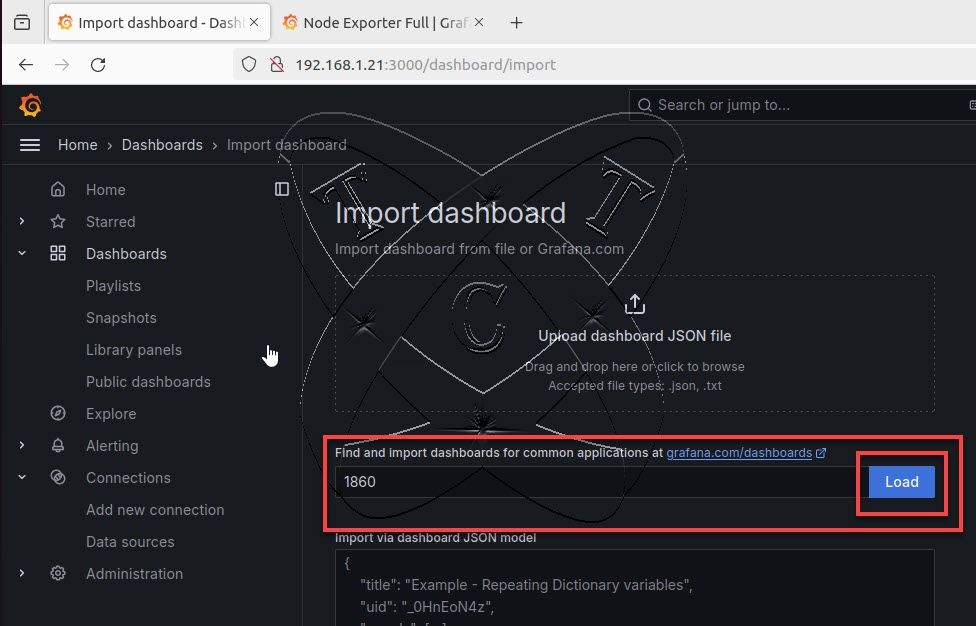
Return to the Import dashboard page, paste the Dashboard ID, and click the Load button
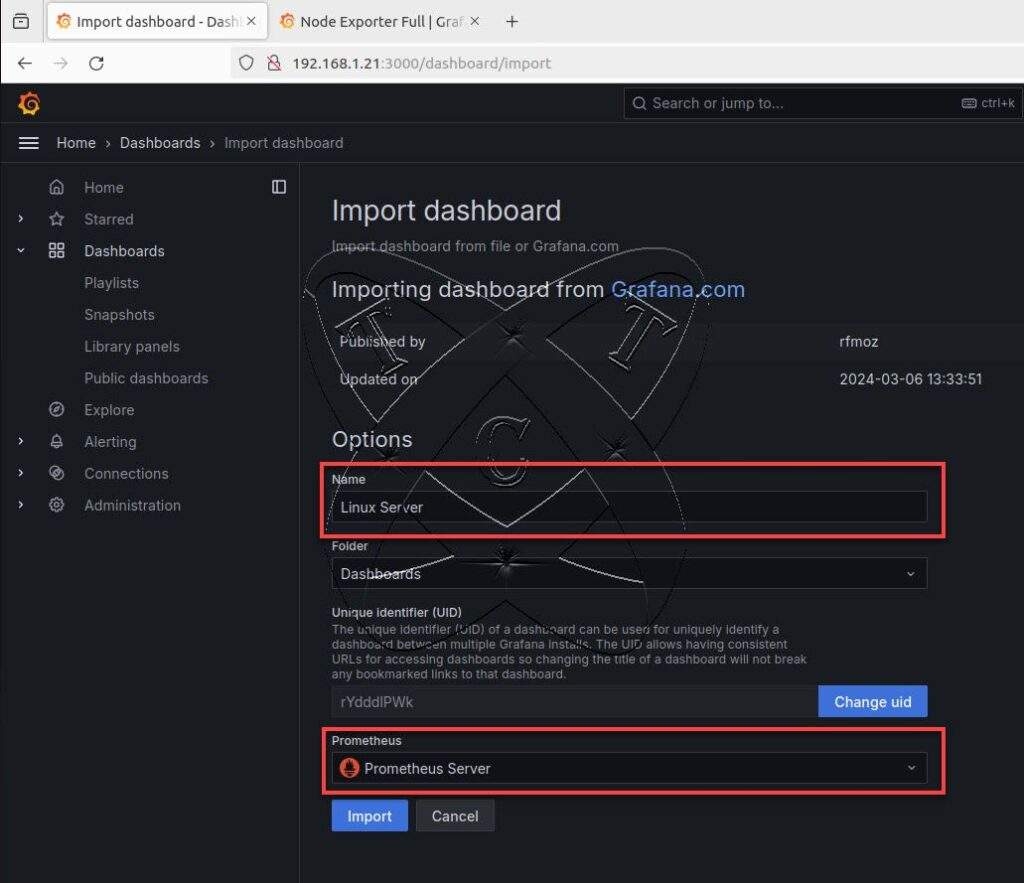
Declare the following parameters:
- Name: Enter your name (as you prefer)
- Prometheus: Select the data source created in step 1
and then click the Import button
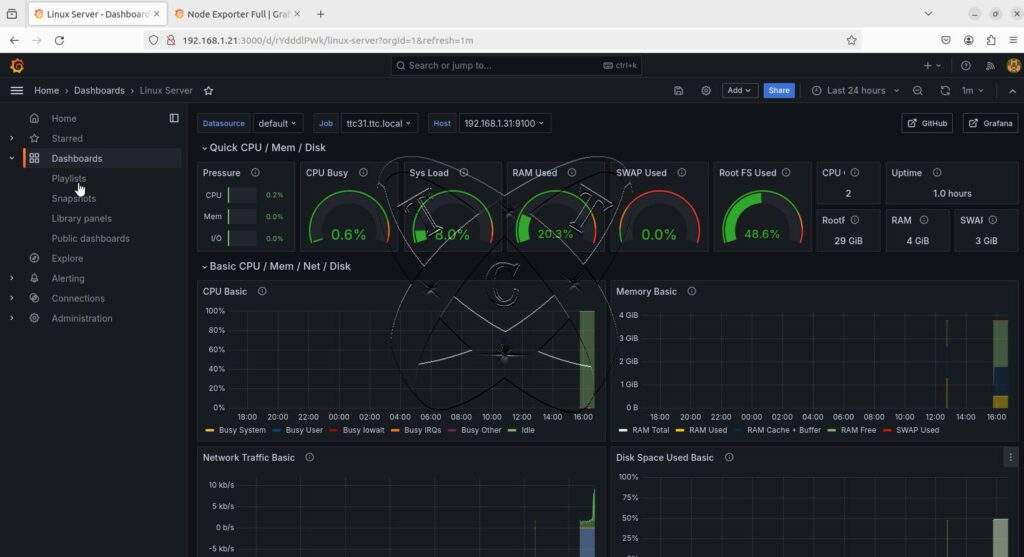
If successful, you will see results similar to the following:
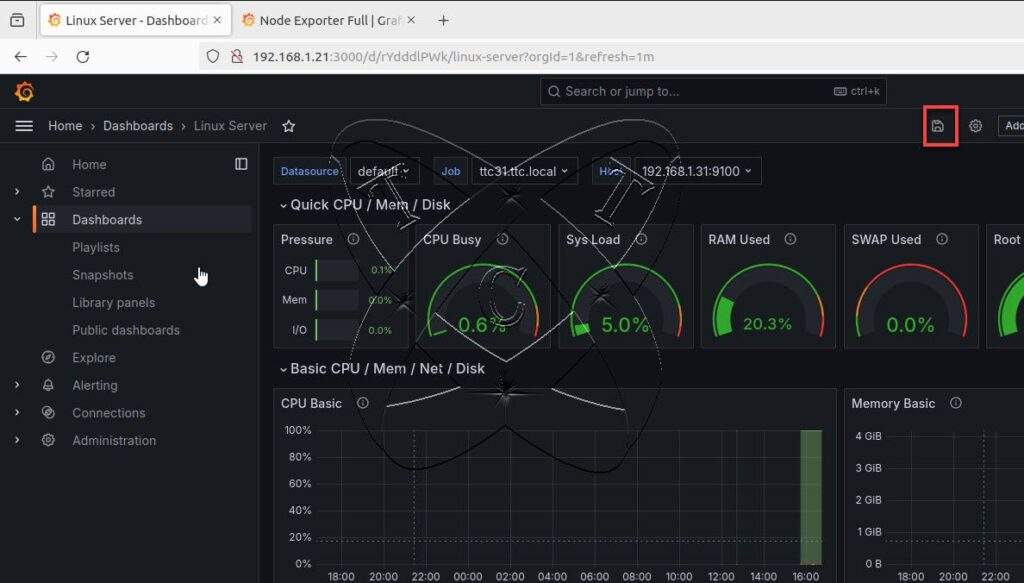
Step 3 – Create a Dashboard
On the Dashboard screen, click the Save button:
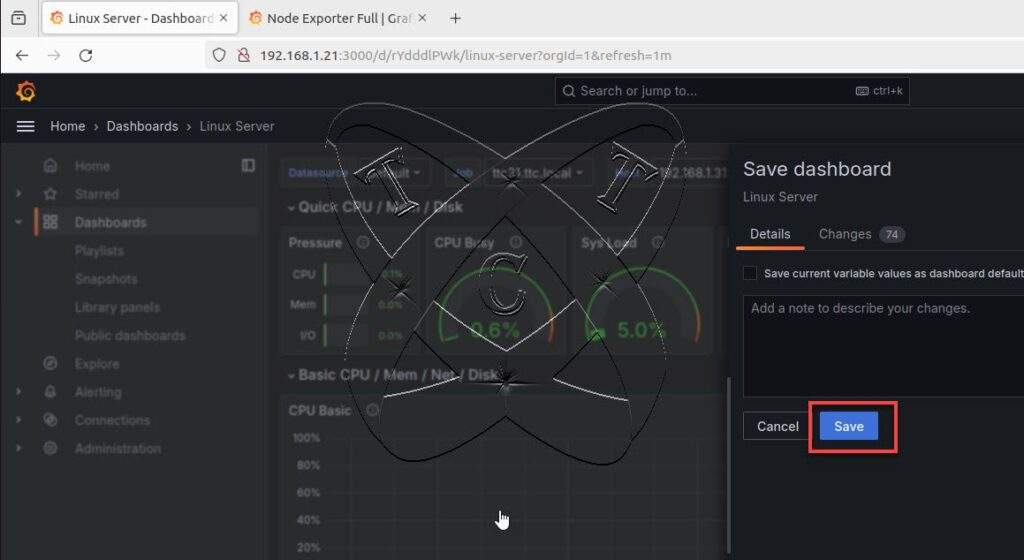
A window will appear; click on the Save button:
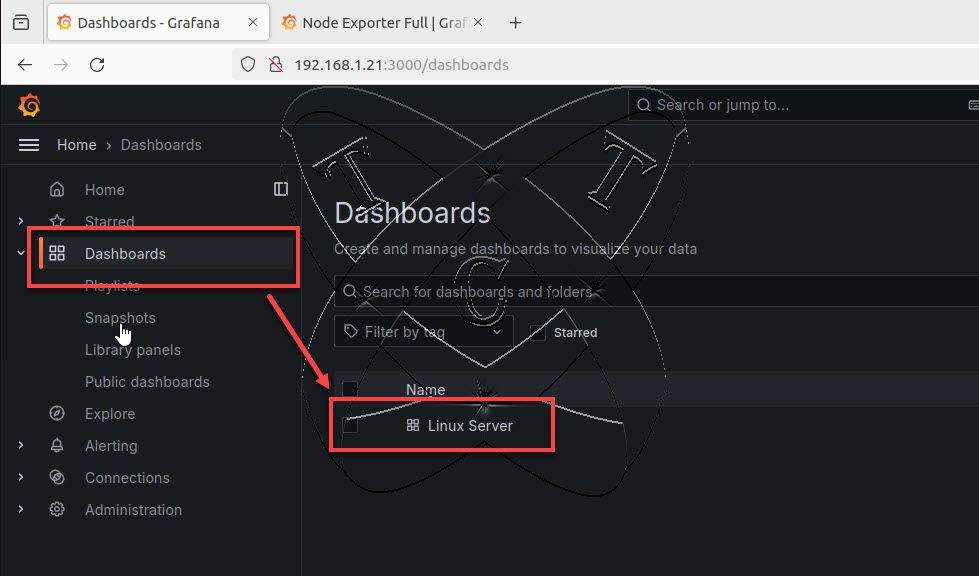
From the menu, select Dashboards, and on the right, you can explore the newly created dashboard:
Read more
- How to Install and Configure Snipe-IT Tool on Ubuntu / Debian
- How to Install and Configure MariaDB Server on Ubuntu
- Set up A Mail Server with PostfixAdmin on Ubuntu – Part 1